Revenue forecasts for amusement rides fail for a simple reason: they start with the ride’s capacity instead of the park’s visitors. Capacity tells you the maximum the machine can carry. Revenue tells you what the market will actually pay, and those two numbers can differ by a factor of five on the same installation.
This article sets out how to calculate the revenue potential of a 42m sky flyer ride for sale before the contract is signed, using four inputs that can be sourced from the park’s own records rather than from the supplier’s brochure.
1. Revenue Is a Function of Four Numbers
Annual ride revenue equals annual riders multiplied by the revenue per rider. Annual riders equals annual visitors multiplied by the ride participation rate. So the whole model reduces to four inputs: visitors per year, the share who ride the tower, the price they pay, and the number of operating days available.
Everything else — capacity, cycle time, queue management — only sets the ceiling. Model the four inputs first, then check that the resulting ridership fits inside the ceiling. If it does not, the assumption is wrong rather than the ride.
2. Attendance and Ride Participation
Start with last year’s attendance, not a projection for a park that does not exist yet. If the park already operates, the data is in the ticketing system. If it is new, use attendance from comparable parks in the same market and adjust for size and catchment.
Participation is the harder number. A tower ride typically captures a meaningful share of visitors on a busy day but a much smaller share on a quiet one, because the same core visitors ride it repeatedly. The practical method is to estimate participation for an observation swing ride at three levels — 10 per cent, 15 per cent and 20 per cent — and run the model at each. That range is wide enough to show whether the investment is robust or fragile.
3. Ticket Price and the Bundle Question
How the ride is sold changes both revenue and behaviour. A separate ride ticket produces clear per-ride revenue and is easy to model. A wristband or day pass that includes the tower produces higher total ticket revenue but makes the ride’s contribution harder to isolate. A premium evening ticket can combine the two.
Whichever model the park uses, allocate a defensible share of the bundle price to the tower. If a day pass costs USD 30 and includes twelve attractions, the tower is not worth USD 30 per rider — it is worth its share of the package. Models that count the full pass price as ride revenue are the most common source of over-optimistic forecasts.
4. Operating Days and Weather Loss
Operating days are calendar days minus closures. Start with the park’s published season, then subtract days lost to weather, maintenance, public holidays when the park is shut and any period when the ride itself is unavailable.
A tower has a maximum operating wind speed, and exposed or coastal sites lose more days than inland parks. If the ride is expected to close for 15 days a season because of wind, that loss belongs in the model from the start rather than appearing as a surprise in the first quarter.
5. Capacity: The Ceiling, Not the Forecast
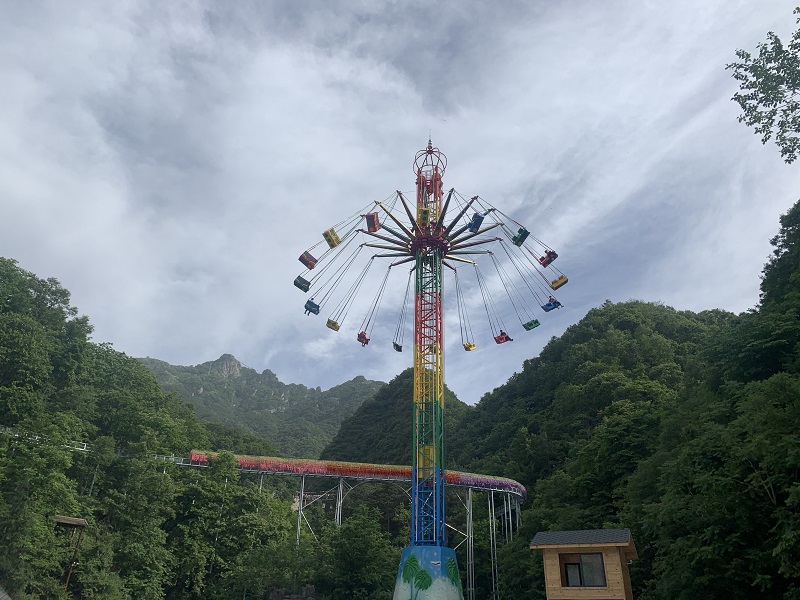
The 42 m configuration carries 32 passengers. With a cycle of roughly three to four minutes including loading and restraint checks, the theoretical throughput is high enough that capacity will almost never be the binding constraint outside a handful of peak weekends.
Use capacity to test the forecast: if the model predicts more riders in a day than the machine can physically carry in the operating hours available, the forecast is wrong. Otherwise capacity is a comfort margin, not a revenue driver.
6. Year-One Ramp-Up
A new ride does not reach its steady-state ridership on opening day. Marketing takes time, word of mouth builds, and the first weeks are usually affected by teething problems and staff learning. A realistic first-year model applies a ramp-up curve — perhaps 60 per cent of steady-state in the first month, 80 per cent in the second, and full rate from the third.
Parks that ignore ramp-up overstate first-year revenue and then understate the payback period by several months. The star flyer investment case is strong enough without that error.
7. A Worked Revenue Model
Illustrative assumptions, to be replaced with the park’s own data:
- Annual visitors: 400,000
- Ride participation rate: 15 per cent
- Annual riders: 60,000
- Average revenue per rider: USD 5
- Gross ride revenue: USD 300,000
- Operating days: 250
- Average riders per operating day: 240
At 10 per cent participation the same park produces USD 200,000; at 20 per cent it produces USD 400,000. That is a wide spread, which is exactly why the participation rate should be tested against comparable attractions rather than assumed.
8. Sensitivity Analysis
Build a small table that varies participation and price together. The useful output is not a single number but the range in which the project remains viable. If the ride still covers its operating cost at 10 per cent participation and a reduced ticket price, the investment has a margin of safety. If it only works at the optimistic corner, it is a bet rather than a plan.
Run the same table with 15 per cent fewer operating days. Weather and maintenance losses compound quickly, and a model that survives that test is one that can be defended to a lender.
9. What to Confirm Before Signing
Ask the supplier for the capacity and cycle-time data in writing, the maximum operating wind speed, the recommended operating and maintenance schedule, and the expected downtime for routine inspection. Ask for references in similar markets and, where possible, speak to those operators about actual ridership rather than about the ride itself.
A star flyer by Dinis is normally quoted with the technical data needed for this modelling, including the load schedule and foundation data, so the revenue case and the cost case can be built on the same assumptions. Dinis has supplied tower rides, ferris wheels, swing chairs and complete park equipment packages from Zhengzhou, China for more than twenty years. As an amusement ride supplier, the company provides the documentation, installation guidance and after-sales support that let an investor move from estimate to projection.
The structure of the ride is fabricated from steel, and the specification of that steel is what decides whether the maintenance line in the model stays flat for a decade. Revenue potential and structural quality are two halves of the same investment case.
Current project reference: https://www.dinisdreammyland.com/products/42-m-sky-flyer-ride-for-sale/